Multi-region monitoring is ready

Know what broke.Before your users do.

ArxEyes watches websites, APIs and infrastructure from the regions you choose—then turns every signal into a clear incident, a useful alert and a status update customers can trust.

No credit card · magic-link sign in · first monitor in minutes

app.arxeyes.com / overview
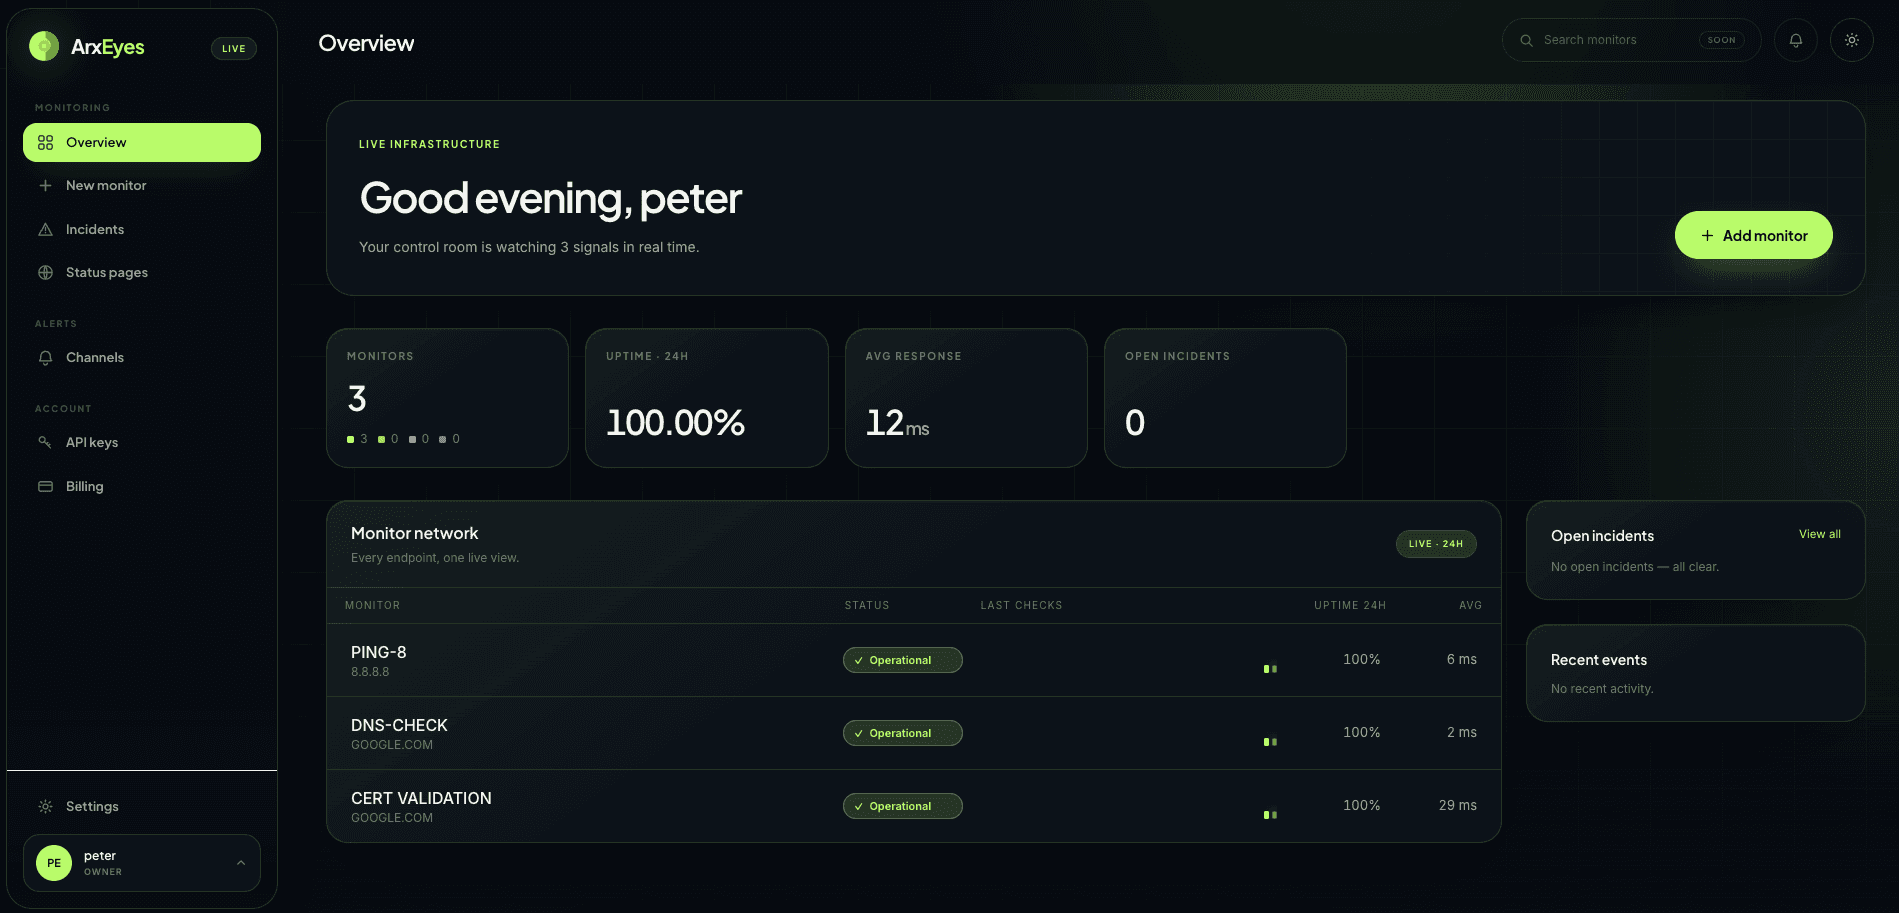
ArxEyes monitoring dashboard showing current uptime, incidents and monitored services

Integrate with the tools your team already uses

Email
Slack
Discord
Telegram
Webhooks

Connect once, use a channel for selected monitors or make it the default for every monitor.

One watchtower, every critical signal

Uptime is more than a green dot.

See where a failure happened, how long it lasted and whether customers are affected—without stitching together five different tools.

Multi-region by design

Run the same monitor from the US, UK, Japan or any probe region you connect. Regional results flow back to one primary control plane, where ArxEyes builds the service-wide picture.

US East
Probe 01 · healthy
United Kingdom
Probe 02 · healthy
Japan
Probe 03 · healthy
Monitor the whole stack

Go beyond homepage checks. Watch the protocol and condition that actually represents health.

HTTP(S)
Keyword
JSON query
TCP port
Ping
DNS
SSL expiry
Push heartbeat

Calm alerts, not alarm fatigue

Control retries and failure thresholds before an incident opens. Notify the right channels for each monitor and send recovery when service returns.

Retry before escalating
Route by monitor
Notify on outage and recovery

See performance drift

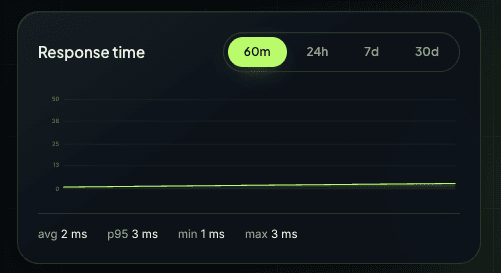
Response-time history makes slow degradation visible before it becomes a hard outage.

ArxEyes response-time chart
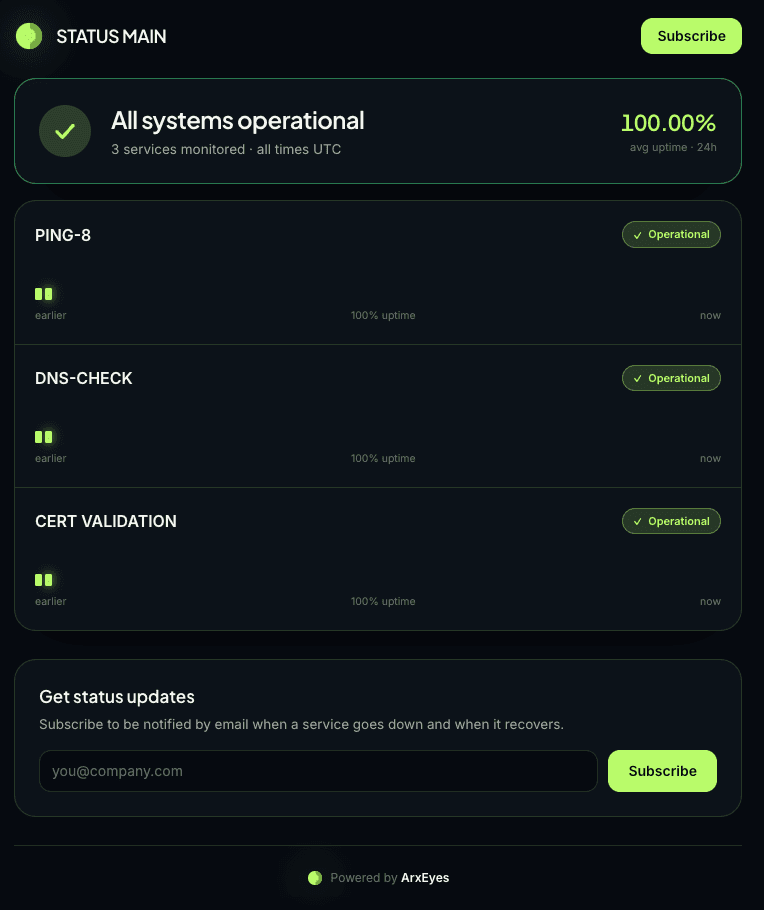
ArxEyes public status page with email subscription
Status pages and subscriber updates

When something breaks, keep everyone in the loop.

Publish a clear status page for every product or customer environment. Visitors can subscribe by email, and ArxEyes sends outage, incident and recovery updates on your behalf.

Live service status
Email subscriptions
Incident timeline
Shareable status URLs
Uptime history
White-label on Business
Publish your first status page
How it works

Three steps from blind spot to clear signal.

/01

Create your account

Use a one-time magic link—no password to store and no social sign-in required.

/02

Add monitors and regions

Choose the exact checks, probe locations, cadence and failure tolerance for each service.

/03

Route alerts and publish

Attach Email, Slack, Discord, Telegram or webhooks, then give customers a status page.

Success stories from our community

Built for people who own the outcome.

No inflated counters or placeholder praise—just the practical jobs ArxEyes helps teams handle every day.

Product teams

Catch API or checkout failures before support tickets arrive, with one incident trail for the whole team.

Agencies

Separate monitoring and status pages for client properties while keeping operations in one workspace.

Infrastructure teams

Compare probe regions, inspect response times and distinguish a local network fault from a real outage.

Simple monthly pricing

Start free. Scale when uptime matters more.

No yearly billing toggle and no hidden annual commitment.

Free

Learn what breaks, for free

$0

Free forever · no card

  • 3 monitors
  • 5-minute checks
  • 1 probe region
  • HTTP, TCP, PING monitors
  • Email notifications
  • 1 status page
  • 1 team seat
  • 1-month history
Most popular

Solo

For one product and a small team

$9/ month

Billed monthly · cancel anytime

  • 10 monitors
  • 1-minute checks
  • 3 probe regions
  • All monitor types, including SSL and DNS
  • Every notification channel
  • 3 status pages
  • 2 team seats
  • 12-month history
  • Response-time thresholds

Business

For teams running critical services

$29/ month

Billed monthly · cancel anytime

  • 100 monitors
  • 30-second checks
  • 10 probe regions
  • All monitor types, including SSL and DNS
  • Every notification channel
  • 100 status pages
  • 3 team seats
  • 12-month history
  • Response-time thresholds
  • White-label status pages

Custom

For larger fleets and tailored operations

Let’s talk

Built around your requirements

  • More monitors, regions and seats
  • Tailored data retention
  • Migration and onboarding support
  • Direct support at support@arxeyes.com
Questions, answered

Before you switch the watchtower on.

What can ArxEyes monitor?

Websites and APIs over HTTP(S), body keywords, JSON responses, TCP ports, ping targets, DNS records, SSL certificate expiry and push heartbeats for cron jobs and workers.

How does multi-region monitoring work?

Choose the probe regions for a monitor. ArxEyes collects each regional result on the primary control plane and uses the combined signal to avoid treating one local network problem as a global outage.

Can customers subscribe to a status page?

Yes. Visitors can subscribe by email, and ArxEyes sends incident and recovery updates on your behalf. Solo includes three status pages; Business includes one hundred.

What is included in the free plan?

Three HTTP, port or ping monitors with five-minute checks, email notifications and one public status page. No credit card is required.

Your first signal is minutes away

Stop discovering outages from your customers.

Create an account with a magic link, add your first monitor, and let ArxEyes keep watch.